WQC 2001 Eastern Soft
Wheat Tour
by James Quinton
◄Back
to Archive
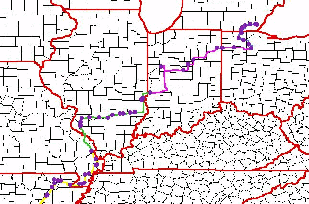
On the map is a crop
scout "trail" traveled by one of our participants this year. A
handheld GPS tracking device was used to pinpoint wheat fields that were
visited and then to plot them on this map. Participants scouted with a
different driver or passenger each day. This is the composite route of
just one individual who rode in several vehicles. It represents only one
combination of pathways the Tour scouted. Other paths were farther to
the south in Arkansas and also farther to the east in Ohio, for example.
|
sub-regions: |
1996 |
1997 |
1998 |
1999 |
2000 |
sub-region averages 1996-2000 |
2001 |
|
MidSouth (Ark/Mo/Ky) |
60 |
60 |
50 |
67 |
57 |
58.9 |
58.1 |
|
Ohio & Miss Valley
(ILL/SW Ind) |
55 |
65 |
60 |
67 |
60 |
61.3 |
56.5 |
|
Lake Erie (NE
Ind/Ohio/SE Mich) |
68 |
69 |
63 |
64 |
67 |
66.1 |
58.7 |
|
|
|
|
|
|
|
|
|
|
avg of all samples |
68.9 |
66.2 |
59.5 |
66.2 |
61.7 |
|
58.0 |

The table above reviews
tiller counts for the particular sub-groups of counties that the Tour
surveys each season. The 2001 results are at the extreme right. Tiller
counts are only one objective yield component. The number of berries per
head and grain weights would be two more. If all these could be utilized
in a more detailed yield model, the results of the Tour might be more
particular. However, grain weight cannot be determined until harvest,
and counting berries has not been practical. Thus the Tour has been
limited to finding relative changes in tiller populations. As a rule of
thumb, there is approximately 1 bu/acre of yield potential for each 1
tiller/ft2 (a 1:1 ratio).

Tiller counts are low
this season in the surveyed counties. Poor seeding conditions last fall
were a major influence for the Midsouth and River Valley regions. In the
Lake Erie region we donít know what reduced the tiller populations.
That was quite a surprise! Drought conditions across Arkansas, the
Missouri Bootheel and the southern portions of Illinois and Indiana
during April and May appear to have also stunted head size. We found
many heads with just two berries per spikelet, very few with three, and
virtually none with four this year. The southern areas of the Tour are
not having such a good year. However, growing conditions in NE Indiana,
NW Ohio, and Michigan are nearly ideal. Larger head sizes there could
partially offset the impact of low tiller counts.
Chronic wheat diseases
appeared to be almost absent. Powdery mildew was noted in the Lake Erie
region, but at low levels. That crop is just now heading and flowering;
vulnerability is high. However, odds for an outbreak of Head Scab
up there seem low due to cold temperatures.
Army worm activity was
found, though it was not a universal problem. Damage seemed to be
localized. Alerts were loudly and universally distributed,
however, and that may have given the impression of a bigger problem than
actually existed. Where worms were active grass pastures suffered more
extensively than field crops. Spraying seemed to control worms. Lack of
treatment did result in some damage to wheat, mainly the removal of flag
leaves and that will likely limit grain filling. Yields and test weights
in damaged spots could be reduced. Overall it isnít a big factor.
|