WHEAT QUALITY COUNCIL
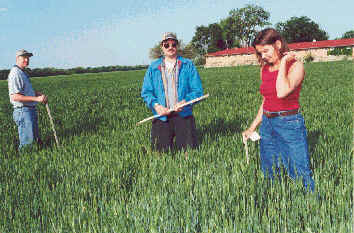
May 2-4, 2000 Summary by Ben Handcock Sixteen cars and 60 participants surveyed the potential of the Kansas wheat crop the week of May 1-4. The total number of field stops was 479. Crop scouts received a brief training and overview session on May 1 in Salina, KS. On May 2, the sixteen cars traveled on six different routes and arrived that evening in Colby, KS. The scouts saw barley yellow dwarf, wheat streak mosaic and serious insect damage in widespread areas. The most serious problem noticed on day one was drought stressed wheat. Recent rains were too late to make the small wheat heads normal in size. Moisture will help to fill the smaller heads, however. Day two saw the cars going from Colby, KS to Wichita, KS. Most observers felt the wheat was noticeably better in this area of the state. Barley yellow dwarf was still a pretty common problem. Day three concluded with a final survey of fields from Wichita to Kansas City. The wheat in this part of the state was excellent, but this is not a large wheat production area in Kansas. The results of each day can be seen in the accompanying tables for days 1,2,3 plus the three-day composite. Our calculated formula result for the entire trip was 41.4 bushels per acre versus 38.4 bushels on the same routes last year. Forty-seven tour participants estimated the total production for Kansas at an average of 382.4 million bushels. This compares with our estimate of 412.2 million bushels last year. The final USDA number for Kansas last year was 432.4 million bushels. Nebraska, Colorado and Oklahoma also gave the group results of their own state surveys. Nebraska pegged its crop at 39.8 bushels versus 48.5 in 1999. Colorado estimated yields of 42.8 bushels compared with 49 bushels in 1999. Oklahoma’s tour resulted in a yield estimate of 35.3 bushels per acre and a total crop of 155.4 million bushels. The weather in the next few weeks will have a profound influence on this crop. With the disease pressure noted, this crop could get larger or smaller as we approach harvest.
|
||||||||||||||||||||||||||||||||||||||||||||||||||||||||||||||||||||||||||||||||||||||||||||||||||||||||||||||||||||||||||||||||||||||||||||||||||||||||||||||||||||||||||||||||||||||||||||||||||||||||||||||||||||||||||||||||||||||||||||||||||||||||||||||||||||||||||||||||||||||||||||||||||||||||||||||||||||||||||||||||||||||||||||||||||||||||||||||||||||||||||||||||||||||||||||||||||||||||||||||||||||||||||||||||||||||||||||||||||||||||||||||||||||||||||||||||||||||||||||||||||||||||||||||||||||||||||||||||||||||||||||||||||||||||||||||||||
| ▲Back to Top ◄Back to Archive | ||||||||||||||||||||||||||||||||||||||||||||||||||||||||||||||||||||||||||||||||||||||||||||||||||||||||||||||||||||||||||||||||||||||||||||||||||||||||||||||||||||||||||||||||||||||||||||||||||||||||||||||||||||||||||||||||||||||||||||||||||||||||||||||||||||||||||||||||||||||||||||||||||||||||||||||||||||||||||||||||||||||||||||||||||||||||||||||||||||||||||||||||||||||||||||||||||||||||||||||||||||||||||||||||||||||||||||||||||||||||||||||||||||||||||||||||||||||||||||||||||||||||||||||||||||||||||||||||||||||||||||||||||||||||||||||||||