![]() Hard
Spring Wheat Quality Tour 2007
Hard
Spring Wheat Quality Tour 2007
| DAY 1 | 2007 SPRING WHEAT CROP TOUR | |||||||||||||||
| 24-Jul-07 | ||||||||||||||||
| Route | Class | Est. | Calc. | Std | Hi | Lo | # | 2006 | 2005 | 2004 | 2003 | 2002 | 2001 | 2000 | ||
| 2007 | 2007 | Dev | Fields | |||||||||||||
| Purple #1 | HRS | 40.0 | 37.5 | 9.8 | 54.0 | 19.0 | 14 | 25.0 | 41.7 | 44.3 | 40.1 | 26.4 | 36.9 | 33.6 | ||
| DUR | ||||||||||||||||
| HRW | ||||||||||||||||
| Green #2 | HRS | 50.7 | 49.1 | 9.5 | 73.0 | 34.0 | 15 | 25.7 | 36.7 | 38.6 | 40.5 | 22.4 | 43.6 | |||
| DUR | ||||||||||||||||
| HRW | 39.1 | |||||||||||||||
| Yellow #3 | HRS | 44.0 | 11.6 | 61.0 | 22.0 | 12 | 38.3 | 36.6 | 49.2 | 42.0 | 24.2 | 41.8 | 35.9 | |||
| DUR | ||||||||||||||||
| HRW | ||||||||||||||||
| Orange #4 | HRS | 38.3 | 33.5 | 6.5 | 46.0 | 25.3 | 8 | 38.3 | 42.7 | 37.9 | 50.2 | 28.6 | 28.8 | 29.4 | ||
| DUR | 43.4 | |||||||||||||||
| HRW | 41.5 | 37.4 | 40.4 | 34.3 | 2 | |||||||||||
| Red #5 | HRS | 46.7 | 39.5 | 8.5 | 50.0 | 23.0 | 13 | 37.8 | 31.9 | 42.9 | 41.2 | 26.6 | 35.8 | 36.1 | ||
| DUR | 29.2 | 20.0 | ||||||||||||||
| HRW | ||||||||||||||||
| Pink #6 | HRS | 25.0 | 19.8 | 9.3 | 31.6 | 0.0 | 15 | 27.4 | 42.7 | 48.3 | 35.6 | 35.9 | 38.4 | 40.5 | ||
| DUR | 17.4 | 51.0 | 16.0 | 30.7 | ||||||||||||
| HRW | ||||||||||||||||
| Blue #7 | HRS | 45.2 | 11.9 | 63.6 | 28.0 | 9 | 17.9 | 31.8 | 25.7 | 26.9 | 13.3 | 32.5 | 36.4 | |||
| DUR | 36.7 | 1 | 25.4 | 23.0 | 31.5 | 30.9 | ||||||||||
| HRW | 21.4 | |||||||||||||||
| Black #8 | HRS | 31.0 | 28.2 | 9.2 | 40.4 | 8.6 | 12 | 29.3 | 29.7 | 26.4 | 27.5 | 29.8 | 25.9 | 22.7 | ||
| DUR | 24.5 | 24.2 | 18.0 | 31.5 | 22.6 | |||||||||||
| HRW | 38.3 | 49.7 | 23.9 | 3 | 45.0 | 52.0 | ||||||||||
| Purple #9 | HRS | No Route | 41.0 | 38.8 | ||||||||||||
| DUR | 28.0 | |||||||||||||||
| HRW | 35.0 | |||||||||||||||
| Green #10 | HRS | No Route | 35.5 | 36.5 | 39.7 | |||||||||||
| DUR | 28.7 | |||||||||||||||
| HRW | ||||||||||||||||
| Yellow #11 | HRS | 38.1 | 35.2 | 5.0 | 41.6 | 27.7 | 12 | 26.1 | 36.2 | 27.4 | ||||||
| DUR | 22.4 | |||||||||||||||
| HRW | ||||||||||||||||
| Orange #12 | HRS | 38.0 | 31.5 | 8.7 | 50.0 | 23.0 | 13 | 35.9 | 23.9 | 29.4 | 33.7 | |||||
| DUR | 25.0 | |||||||||||||||
| HRW | 60.0 | |||||||||||||||
| Red #13 | HRS | No Route | 35.1 | 35.6 | 43.8 | 35.1 | ||||||||||
| DUR | 17.2 | |||||||||||||||
| HRW | ||||||||||||||||
| Pink #14 | HRS | 35.6 | 36.5 | 14.0 | 57.4 | 0.0 | 13 | 37.9 | 37.4 | 44.9 | ||||||
| DUR | 29.0 | 22.7 | ||||||||||||||
| HRW | ||||||||||||||||
| Blue #15 | HRS | No Route | ||||||||||||||
| DUR | ||||||||||||||||
| HRW | ||||||||||||||||
| Black #16 | HRS | No Route | ||||||||||||||
| DUR | ||||||||||||||||
| HRW | ||||||||||||||||
| EST. | CALC. | SD | Flds | Weighted Averages | ||||||||||
| Wt. Avg. | 28.2 | 36.2 | 12.5 | 142 | 2006 | 2005 | 2004 | 2003 | 2002 | 2001 | 2000 | |||
| HRS | 38.2 | 36.2 | 12.6 | 136 | Wt. Avg. | 31.1 | 36.4 | 37.4 | 36.9 | 27.1 | 35.2 | 35.5 | ||
| DUR | 36.7 | 1 | HRS | 31.2 | 36.8 | 37.8 | 37.5 | 27.2 | 35.7 | 35.8 | ||||
| HRW | 41.5 | 37.9 | 5 | DUR | 28.5 | 26.7 | 20.5 | 26.8 | 10.7 | 27.3 | 26.4 | |||
| HRW | 21.4 | 38.5 | 45 | 49 | ||||||||||
| Fields HRS | 106 | 100 | 118 | 125 | 134 | 145 | 165 | |||||||
| Fields DUR | 2 | 2 | 3 | 9 | 1 | 10 | 10 | |||||||
| Fields HRW | 1 | 3 | 1 | 3 | ||||||||||
| Total Fields | 108 | 103 | 124 | 135 | 135 | 155 | 178 | |||||||
| DAY 2 | 2007 SPRING WHEAT CROP TOUR | |||||||||||||||
| 25-Jul-07 | ||||||||||||||||
| Route | Class | Est. | Calc. | Std | Hi | Lo | # | 2006 | 2005 | 2004 | 2003 | 2002 | 2001 | 2000 | ||
| 2007 | 2007 | Dev | Fields | |||||||||||||
| Purple #1 | HRS | 37.0 | 35.4 | 11.6 | 57.0 | 18.0 | 13 | 29.8 | 30.8 | 35.4 | 38.0 | 40.0 | 39.9 | 40.9 | ||
| DUR | 32.0 | 28.0 | 1 | 35.2 | 44.0 | 47.3 | 24.0 | 22.3 | 29.4 | |||||||
| HRW | ||||||||||||||||
| Green #2 | HRS | 39.4 | 34.1 | 5.9 | 43.0 | 23.5 | 11 | 25.9 | 29.7 | 37.4 | 31.3 | 35.1 | 33.0 | |||
| DUR | 22.0 | 25.0 | 1 | 15.1 | 17.7 | 30.4 | 24.4 | |||||||||
| HRW | ||||||||||||||||
| Yellow #3 | HRS | 39.6 | 39.9 | 6.8 | 54.7 | 31.2 | 13 | 31.7 | 41.4 | 36.4 | 38.8 | 28.3 | 34.8 | 42.0 | ||
| DUR | 13.7 | 27.3 | 48.5 | 25.9 | ||||||||||||
| HRW | ||||||||||||||||
| Orange #4 | HRS | 35.0 | 34.3 | 7.2 | 44.7 | 25.7 | 8 | 35.2 | 33.8 | 34.6 | 23.8 | 25.6 | 34.4 | 33.2 | ||
| DUR | 37.0 | 34.9 | 4.5 | 40.0 | 29.0 | 4 | 29.6 | 32.0 | 29.1 | 22.8 | 26.4 | 29.5 | 29.5 | |||
| HRW | 40.5 | |||||||||||||||
| Red #5 | HRS | 41.3 | 39.6 | 8.8 | 52.0 | 24.5 | 12 | 28.2 | 30.8 | 36.9 | 29.1 | 35.6 | 42.5 | 39.3 | ||
| DUR | 34.0 | 34.7 | 34.2 | 23.8 | 46.6 | 22.5 | 30.6 | |||||||||
| HRW | ||||||||||||||||
| Pink #6 | HRS | 34.8 | 34.2 | 9.0 | 41.1 | 21.0 | 4 | 27.6 | 37.4 | 27.0 | 26.9 | 33.1 | 26.4 | 25.0 | ||
| DUR | 26.8 | 28.3 | 10.2 | 56.8 | 20.3 | 12 | 20.8 | 27.4 | 31.4 | 22.3 | 22.9 | 31.1 | 29.5 | |||
| HRW | 41.0 | 35.8 | 42.6 | 29.1 | 2 | |||||||||||
| Blue #7 | HRS | 34.0 | 36.2 | 7.5 | 46.0 | 27.0 | 13 | 30.0 | 31.4 | 33.9 | 35.8 | 28.7 | 30.1 | 38.1 | ||
| DUR | 7.0 | 38.0 | 26.6 | 26.7 | 23.6 | |||||||||||
| HRW | ||||||||||||||||
| Black #8 | HRS | 33.5 | 36.2 | 6.8 | 49.6 | 24.8 | 12 | 30.4 | 29.7 | 33.9 | 31.2 | 25.0 | 26.8 | 30.8 | ||
| DUR | 21.0 | 22.9 | 16.9 | 34.8 | 10.9 | 2 | 20.3 | 27.4 | 39.0 | 31.8 | 21.6 | 16.6 | 30.5 | |||
| HRW | 40.6 | 38.2 | ||||||||||||||
| Purple #9 | HRS | No Route | 30.2 | |||||||||||||
| DUR | 31.2 | 28.9 | ||||||||||||||
| HRW | ||||||||||||||||
| Green #10 | HRS | No Route | 26.4 | 32.3 | 27.2 | |||||||||||
| DUR | 15.8 | 26.6 | 27.1 | |||||||||||||
| HRW | ||||||||||||||||
| Yellow #11 | HRS | No Route | 0.0 | 0.0 | 0 | 36.1 | 35.0 | 31.8 | ||||||||
| DUR | 0.0 | 0.0 | 0 | 13.4 | 28.5 | |||||||||||
| HRW | ||||||||||||||||
| Orange #12 | HRS | 29.0 | 29.1 | 16.1 | 46.0 | 13.9 | 3 | 25.4 | 31.7 | 33.8 | 40.7 | |||||
| DUR | 29.8 | 29.4 | 7.2 | 40.3 | 20.8 | 10 | 28.5 | 25.4 | 29.5 | 32.8 | ||||||
| HRW | 45.0 | |||||||||||||||
| Red #13 | HRS | No Route | 36.3 | 40.9 | 39.2 | 28.5 | ||||||||||
| DUR | 32.3 | 18.9 | 32.8 | 23.6 | ||||||||||||
| HRW | ||||||||||||||||
| Pink #14 | HRS | 27.8 | 26.6 | 5.6 | 33.2 | 17.9 | 6 | 29.6 | 24.2 | 36.3 | ||||||
| DUR | 31.3 | 27.8 | 3.0 | 32.7 | 24.4 | 7 | 25.7 | 22.0 | 24.8 | |||||||
| HRW | 30.0 | 32.3 | 1 | |||||||||||||
| Blue #15 | HRS | No Route | ||||||||||||||
| DUR | ||||||||||||||||
| HRW | ||||||||||||||||
| Black #16 | HRS | No Route | ||||||||||||||
| DUR | ||||||||||||||||
| HRW | ||||||||||||||||
| EST. | CALC. | SD | Flds | Weighted Averages | ||||||||||
| Wt. Avg. | 34.3 | 33.8 | 8.9 | 135 | 2006 | 2005 | 2004 | 2003 | 2002 | 2001 | 2000 | |||
| HRS | 36.2 | 35.7 | 8.6 | 95 | Wt. Avg. | 28.8 | 32 | 34.2 | 31.4 | 29.9 | 31.2 | 31.6 | ||
| DUR | 29.3 | 28.8 | 7.9 | 37 | HRS | 29.5 | 32.6 | 34.9 | 33.7 | 32 | 33.3 | 34.9 | ||
| HRW | 37.3 | 34.7 | 3 | DUR | 23.5 | 29.8 | 30.8 | 27.4 | 25.5 | 28.2 | 28.2 | |||
| HRW | 45 | 40.6 | 40.5 | 38.2 | ||||||||||
| Fields HRS | 104 | 82 | 103 | 95 | 97 | 95 | 88 | |||||||
| Fields DUR | 17 | 25 | 22 | 56 | 45 | 65 | 88 | |||||||
| Fields HRW | 1 | 1 | 1 | 0 | 0 | 1 | ||||||||
| Total Fields | 122 | 108 | 125 | 152 | 142 | 160 | 177 | |||||||
| DAY 3 | 2007 SPRING WHEAT CROP TOUR | |||||||||||||||
| 26-Jul-07 | ||||||||||||||||
| Route | Class | Est. | Calc. | Std | Hi | Lo | # | 2006 | 2005 | 2004 | 2003 | 2002 | 2001 | 2000 | ||
| 2007 | 2007 | Dev | Fields | |||||||||||||
| Purple #1 | HRS | 39.4 | 45.1 | 8.1 | 53.7 | 33.7 | 7 | 41.6 | 46.8 | 48.1 | 45.7 | 44.3 | 28.9 | 39.7 | ||
| DUR | 52.7 | 28.0 | ||||||||||||||
| HRW | 45.5 | |||||||||||||||
| Green #2 | HRS | 38.8 | 42.1 | 4.8 | 48.2 | 34.4 | 8 | 39.2 | 35.5 | 51.3 | 38.8 | 36.7 | 50.5 | |||
| DUR | 35.2 | |||||||||||||||
| HRW | ||||||||||||||||
| Yellow #3 | HRS | 39.1 | 46.3 | 9.9 | 67.2 | 31.6 | 12 | 34.6 | 38.3 | 42.8 | 47.2 | 38.1 | 41.3 | 40.9 | ||
| DUR | 31.2 | 22.0 | 14.0 | |||||||||||||
| HRW | ||||||||||||||||
| Orange #4 | HRS | 32.0 | 32.6 | 10.0 | 45.8 | 23.5 | 4 | 34.9 | 42.7 | 35.8 | 46.9 | 32.7 | 33.7 | |||
| DUR | 46.8 | 31.7 | 36.0 | 10.3 | ||||||||||||
| HRW | ||||||||||||||||
| Red #5 | HRS | 52.5 | 52.5 | 3.5 | 55.0 | 50.0 | 2 | 43.9 | 36.6 | 50.7 | 38.9 | 37.3 | 35.4 | 43.1 | ||
| DUR | 17.0 | |||||||||||||||
| HRW | ||||||||||||||||
| Pink #6 | HRS | 42.0 | 45.0 | 5.6 | 50.0 | 39.0 | 3 | 32.2 | 37.1 | 42.2 | 45.2 | 35.9 | 33.0 | 38.2 | ||
| DUR | 18.6 | 25.5 | ||||||||||||||
| HRW | ||||||||||||||||
| Blue #7 | HRS | 35.2 | 40.5 | 4.9 | 45.3 | 33.4 | 6 | 39.3 | 35.0 | 41.5 | 36.7 | 40.7 | 33.9 | 34.6 | ||
| DUR | 29.7 | |||||||||||||||
| HRW | ||||||||||||||||
| Black #8 | HRS | 40.3 | 43.7 | 14.1 | 63.7 | 22.5 | 6 | 31.2 | 29.4 | 42.7 | 37.3 | 41.4 | 28.8 | 36.3 | ||
| DUR | 22.5 | |||||||||||||||
| HRW | ||||||||||||||||
| Purple #9 | HRS | No Route | 21.7 | 29.8 | ||||||||||||
| DUR | 31.3 | |||||||||||||||
| HRW | ||||||||||||||||
| Green #10 | HRS | No Route | 44.3 | 34.6 | 41.3 | |||||||||||
| DUR | 34.9 | 25.2 | 18.4 | |||||||||||||
| HRW | ||||||||||||||||
| Yellow #11 | HRS | No Route | 41.6 | 41.2 | 40.6 | |||||||||||
| DUR | 49.8 | |||||||||||||||
| HRW | ||||||||||||||||
| Orange #12 | HRS | No Route | 31.1 | 38.1 | ||||||||||||
| DUR | 11.5 | 9.9 | ||||||||||||||
| HRW | ||||||||||||||||
| Red #13 | HRS | No Route | 52.0 | 41.4 | 40.3 | 47.3 | ||||||||||
| DUR | 49.2 | |||||||||||||||
| HRW | ||||||||||||||||
| Pink #14 | HRS | 37.1 | 9.5 | 51.0 | 26.0 | 7 | 35.4 | 44.7 | 34.9 | |||||||
| DUR | ||||||||||||||||
| HRW | ||||||||||||||||
| Blue #15 | HRS | No Route | ||||||||||||||
| DUR | ||||||||||||||||
| HRW | ||||||||||||||||
| Black #16 | HRS | No Route | 28.7 | |||||||||||||
| DUR | 20.4 | |||||||||||||||
| HRW | ||||||||||||||||
| EST. | CALC. | SD | Flds | Weighted Averages | ||||||||||
| Wt. Avg. | 34.9 | 42.6 | 9.4 | 55 | 2006 | 2005 | 2004 | 2003 | 2002 | 2001 | 2000 | |||
| HRS | 38.9 | 42.6 | 9.4 | 55 | Wt. Avg. | 37 | 37.1 | 44.5 | 41.8 | 39.9 | 34.5 | 36 | ||
| DUR | 0 | HRS | 36.7 | 37.1 | 44.8 | 41.8 | 40.3 | 35.2 | 38.7 | |||||
| HRW | DUR | 32.7 | 42.1 | 28.9 | 29.7 | 17.3 | ||||||||
| HRW | 45.5 | |||||||||||||
| Fields HRS | 62 | 66 | 84 | 88 | 79 | 76 | 102 | |||||||
| Fields DUR | 0 | 0 | 2 | 6 | 3 | 11 | 15 | |||||||
| Fields HRW | 2 | 0 | 0 | 0 | 0 | 0 | 0 | |||||||
| Total Fields | 64 | 66 | 86 | 94 | 82 | 87 | 117 | |||||||
| 2007 Spring Wheat Crop Tour | ||||||||
| Yield Potential | ||||||||
| Weighted Averages | Standard Deviation | Total Fields | ||||||
| Total | 36.3 | 11.1 | 332 | |||||
| HRS | 37.3 | 11.1 | 286 | |||||
| DUR | 29.0 | 7.9 | 38 | |||||
| HRW | 36.7 | 8 | ||||||
| Overall Weighted Tour Averages | ||||||||||||||
| July 24-26, 2007 | ||||||||||||||
| 1994 | 1995 | ### | 1997 | 1998 | 1999 | 2000 | 2001 | 2002 | 2003 | 2004 | 2005 | 2006 | 2007 | |
| HRS | 37.0 | 32.2 | 36.4 | 31.3 | 32.5 | 30.5 | 36.4 | 34.9 | 32.0 | 37.6 | 38.8 | 35.5 | 31.7 | 37.3 |
| DUR | 39.4 | 32.7 | 29.7 | 27.7 | 26.8 | 23.2 | 26.6 | 28.3 | 25.4 | 28.6 | 29.8 | 29.6 | 23.3 | 29.0 |
| HRW | 54.0 | 65.0 | 39.6 | 46.3 | 42.8 | 38.5 | 31.0 | 45.3 | 36.7 | |||||
| All Wheat | 37.5 | 32.3 | 34.8 | 30.4 | 30.8 | 28.4 | 34.2 | 33.5 | 31.1 | 35.9 | 38.1 | 34.9 | 31.3 | 36.3 |
| Fields Surveyed | ||||||||||||||
| HRS | 254 | 354 | 313 | 388 | 368 | 316 | 325 | 355 | 316 | 310 | 308 | 305 | 272 | 286 |
| DUR | 51 | 99 | 106 | 140 | 132 | 128 | 135 | 113 | 86 | 49 | 71 | 27 | 19 | 38 |
| HRW | 2 | 1 | 0 | 3 | 5 | 0 | 0 | 4 | 0 | 0 | 2 | 3 | 3 | 8 |
| All | 307 | 454 | 419 | 531 | 505 | 444 | 460 | 472 | 402 | 359 | 381 | 335 | 294 | 332 |
| Tour Participants - Breakdown | ||||
| Class | Number | Percent | ||
| Government | 9 | 22 | ||
| University | 2 | 5 | ||
| Media | 2 | 5 | ||
| Grain | 5 | 12 | ||
| Milling | 9 | 22 | ||
| Baker | 4 | 10 | ||
| Producer | 1 | 2 | ||
| Other | 9 | 22 | ||
| Total | 41 | |||
2007 Wheat Quality Council
Hard Spring Wheat & Durum Tour Completed
Summary by Ben Handcock, Executive Vice President
The Wheat Quality Council hard spring wheat and durum tour was conducted July 23-26 in North Dakota plus parts of South Dakota and Minnesota. (Tour map) There were 40 participants this year, one-half of them newcomers.
The 286 spring wheat fields surveyed averaged 37.3 bushels per acre, up from 31.7 in 2006. The 38 durum fields averaged 29 bushels, up from 23.3 a year ago. The 8 hard winter fields we evaluated were listed at 36.7 bushels, down from 45.3 last year.
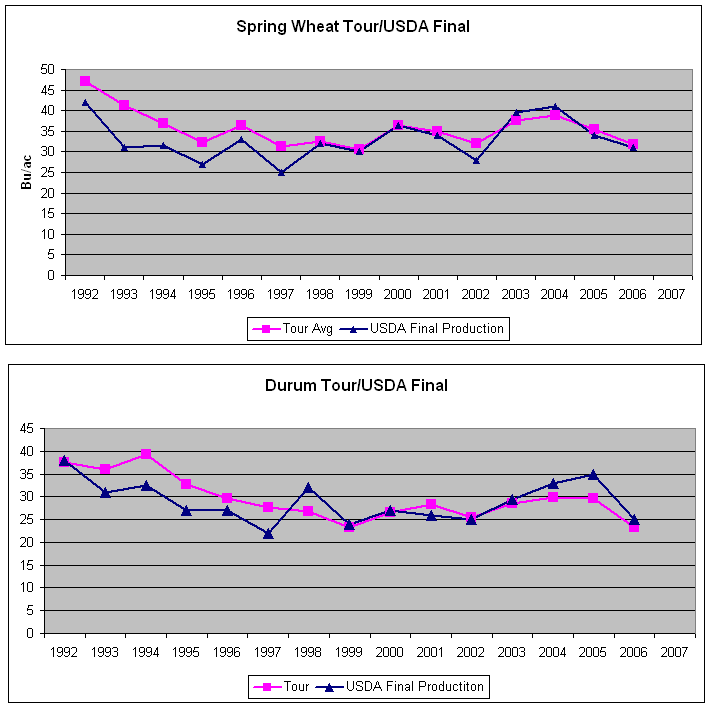
The average for all 332 field stops was 36.3 bushels per acre compared to 31.3 last year and the tour five-year average of 34.26 bushels. (Tour results)
Day one covered the southern half of North Dakota, southwestern Minnesota and northeast/north central South Dakota. Yields were good on all routes and improvement from last year was particularly apparent in the far southwestern routes. Where we saw wheat rolled into bales a year ago, we saw some fields with potential to reach 60 bushels plus this year. The high yield for the day was 73 bushels; the low was 0 (complete hail destruction) with a day one average of 36.2 bushels compared to 31.1 in 2006.
Day two covered the northwest and north central parts of North Dakota. We saw more durum fields this year, possibly just due to our random stops, but nice to see none the less. Once again, the yields were good in all areas. We had a high for the day of 57 bushels, a low of 10.9 and an overall day two average of 33.8 compared to 28.8 bushels last year.
Day three concluded the tour by covering northeast/north central North Dakota and northwest/west central Minnesota. As usual, this was the highest yielding area with an average of 42.6 bushels per acre. We had a high yield of 67.2 and a low of 22.5 bushels. This part of the tour averaged 37 bushels one year ago.
This will be a very nice crop in my view. It was extremely wet in the spring and is extremely dry in most areas right now. We saw very little incidence of scab, which should make everybody happy. We did see some root rot problems and some heat stress (which might increase the protein), but most heads I examined had nice plump kernels.
The biggest issue in most fields was stem maggot. It appeared to be almost everywhere and seems to be getting worse each year. I believe NDSU is working to build some resistance into their varieties, but this will probably take some time.
I don’t believe any of the problems we encountered are severe enough to have much negative influence on this crop. The biggest issue may be getting it harvested in a timely fashion so we don’t have problems similar to those in the southern plains area. Some areas in the northeast had 4-6 inches of rain while we were in the state. We saw nearly ripe fields standing in water. It will take some time to get dry enough to put a combine in those fields.
Over all, this is a crop with very nice potential. The best we have seen in several years, with no apparent serious problems. The good thing for producers is—it’s finally worth something.
Our results are not official. The North Dakota Ag Statistics Service will publish official projections on August 10. Watch for them to see how we compare.
Thanks to all of you who came, drove cars or helped in any way to make this tour a success. The first timers said they learned a great deal, had a lot of fun and they can’t wait to do it again.