![]() Hard
Winter Wheat Quality Tour 2008
Hard
Winter Wheat Quality Tour 2008
| Hard Winter Wheat Quality Tour 2008 | All Averages are Weighted | |||||
| Day One - May 6 | Range | Range | ||||
| Route | Car Average | Stops | Low | High | Route Avg | |
| Purple 1 | 44 | 14 | 28 | 59 | ||
| Purple 2 | 40 | 14 | 15 | 75 | ||
| Purple 3 | ||||||
| Purple 4 | 42 | |||||
| Green 1 | 48 | 14 | 28 | 74 | ||
| Green 2 | 46 | 14 | 24 | 69 | ||
| Green 3 | ||||||
| Green 4 | 47 | |||||
| Pink 1 | 43 | 14 | 20 | 80 | ||
| Pink 2 | 42 | 12 | 27 | 53 | ||
| Pink 3 | 47 | 13 | 30 | 66 | ||
| Pink 4 | 44 | |||||
| Yellow 1 | 49 | 15 | 22 | 76 | ||
| Yellow 2 | 40 | 14 | 25 | 54 | ||
| Yellow 3 | 45 | |||||
| Blue 1 | 54 | 10 | 30 | 94 | ||
| Blue 2 | 48 | 16 | 29 | 74 | ||
| Blue 3 | 41 | 14 | 28 | 71 | 2007 40.0 209 stops | |
| Blue 4 | 47 | 2006 40.6 210 stops | ||||
| Black 1 | 48 | 13 | 30 | 65 | 2005 48.9 192 stops | |
| Black 2 | 48 | 13 | 26 | 71 | 2004 38.0 202 stops | |
| Black 3 | 48 | 2003 38.6 179 stops | ||||
| 2002 37.4 234 stops | ||||||
| Total Stops | 190 | Day 1 Avg | 45.4 | 2001 32.6 212 stops | ||
| Hard Winter Wheat Quality Tour 2008 | All Averages are Weighted | |||||
| Day Two - May 7 | Range | Range | ||||
| Route | Car Average | Stops | Low | High | Route Avg | |
| Purple 1 | 36 | 11 | 26 | 44 | Oklahoma | |
| Purple 2 | 45 | 12 | 28 | 70 | 5.7 MM Planted | |
| Purple 3 | Prod 32.4 bu per acre | |||||
| Purple 4 | 41 | Prod Est 157mm bu | ||||
| Green 1 | 45 | 14 | 28 | 62 | LY 98 MM bu Prod | |
| Green 2 | ||||||
| Green 3 | ||||||
| Green 4 | 45 | |||||
| Pink 1 | 31 | 13 | 11 | 41 | ||
| Pink 2 | 31 | 14 | 0 | 47 | Avg | |
| Pink 3 | 43 | 13 | 22 | 72 | Stops | |
| Pink 4 | 38 | 12 | 26 | 60 | 36 | 2007 2 day 41.6/417 |
| Yellow 1 | 54 | 12 | 19 | 108 | 2006 2 day 37.2/404 | |
| Yellow 2 | 52 | 10 | 23 | 90 | 2005 2 day 46.5/399 | |
| Yellow 3 | 53 | 2004 2-day 36.7/407 | ||||
| Blue 1 | 42 | 9 | 21 | 68 | 2003 2-day 38.1/371 | |
| Blue 2 | 39 | 14 | 21 | 79 | 2002 2-day 34.5/442 | |
| Blue 3 | 32 | 7 | 21 | 42 | 2001 2-day 32.1/438 | |
| Blue 4 | 38 | 2007 D2 43.2/208 stops | ||||
| Black 1 | 48 | 12 | 27 | 88 | 2006 D2 33.5/194 stops | |
| Black 2 | 37 | 14 | 18 | 53 | 2005 D2 44.2/207 stops | |
| Black 3 | 42 | 2004 D2 35.4/205 stops | ||||
| 2003 D2 37.7/192 stops | ||||||
| Total Stops | 167 | Day 2 Avg | 40.9 | 2002 D2 31.3/208 stops | ||
| 2001 D2 31.7/226 stops | ||||||
| Hard Winter Wheat Quality Tour 2008 | All Averages are Weighted | |||||
| Day Three - May 8 | Range | Range | ||||
| Route | Car Average | Stops | Low | High | Route Avg | |
| Purple 1 | ||||||
| Purple 2 | ||||||
| Purple 3 | ||||||
| Purple 4 | ||||||
| Green 1 | 49 | 4 | 28 | 64 | ||
| Green 2 | ||||||
| Green 3 | ||||||
| Green 4 | 49 | |||||
| Pink 1 | 32 | 1 | ||||
| Pink 2 | 35 | 4 | 29 | 41 | ||
| Pink 3 | 40 | 3 | 28 | 49 | ||
| Pink 4 | 37 | |||||
| Yellow 1 | 39 | 5 | 34 | 45 | ||
| Yellow 2 | 49 | 3 | 43 | 54 | ||
| Yellow 3 | 43 | |||||
| Blue 1 | 53 | 3 | 45 | 61 | ||
| Blue 2 | 46 | 4 | 38 | 52 | ||
| Blue 3 | 45 | 1 | ||||
| Blue 4 | 49 | 2007 D3 32.4/30 stops | ||||
| Black 1 | 42 | 3 | 47 | 50 | 2006 D3 38.8/31 stops | |
| Black 2 | 2005 D3 42.8/36 stops | |||||
| Black 3 | 42 | 2004 D3 44.0/46 stops | ||||
| 2003 D3 43.8/45 stops | ||||||
| Total Stops | 31 | Day 3 Avg | 43.3 | 2002 D3 47.3/41 stops | ||
| 2001 D3 39.0/42 stops | ||||||
| Hard Winter Wheat Quality Tour 2008 | ||||||
| Three Day Total | May 1-3, 2008 | Yield Potential | ||||
| All Averages are Weighted | ||||||
| Stops | Stop/Car | Average | Low | High | ||
| Day 1 | 190 | 13.6 | 45.4 | 15 | 94 | |
| Day 2 | 167 | 11.9 | 40.9 | 0 | 108 | |
| Day 3 | 31 | 3.1 | 43.3 | 28 | 64 | |
| Total | 388 | 28.6 | 43.3 | |||
| Historical | ||||||
| Year | Day 1 | Day 2 | Day 3 | Average | Stops | |
| 2007 | 40.0 | 43.2 | 32.4 | 41.0 | 447 | |
| 2006 | 40.6 | 33.5 | 38.8 | 37.3 | 435 | |
| 2005 | 48.9 | 44.2 | 42.8 | 46.2 | 435 | |
| 2004 | 38.0 | 35.4 | 44.0 | 37.4 | 453 | |
| 2003 | 38.6 | 37.7 | 43.8 | 38.8 | 416 | |
| 2002 | 37.4 | 31.3 | 47.3 | 35.6 | 483 | |
| 2001 | 32.6 | 31.7 | 39.0 | 32.7 | 480 | |
| 2000 | 40.8 | 41.4 | 45.1 | 41.4 | 479 | |
| 1999 | 38.0 | 40.0 | 37.2 | 38.9 | 527 | |
| Tour Participants - Breakdown | ||||||
| Class | Number | Percent | ||||
| Government | 6 | 9 | ||||
| University | 6 | 9 | ||||
| Media | 6 | 9 | ||||
| Grain | 9 | 14 | ||||
| Milling | 17 | 27 | ||||
| Baker | 5 | 8 | ||||
| Producers | 3 | 5 | ||||
| Other | 12 | 19 | ||||
| 64 | ||||||
| 10 year | ||||||
| -0.51 | -32.54 | |||||
2008 Wheat
Quality Council Hard Winter Tour Completed
Fourteen cars with
63 crop scouts surveyed and evaluated the potential of the Kansas
wheat crop the week of May 5-8, 2008. The total number of field
stops was 388. This number is down slightly from past years due to
rain and very muddy conditions in some areas.
The
participants attended a brief training and tour overview session in
Manhattan on the evening of May 5 before going to IGP for a steak
fry and some good group interaction.
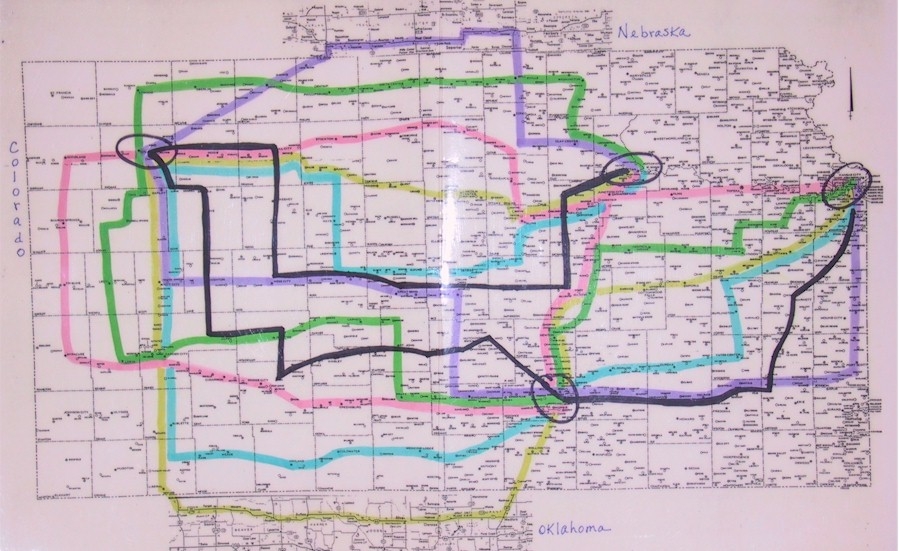
Day one
saw the fourteen cars traveling on six different routes from
Manhattan to Colby (See Tour Map). The wheat seemed pretty
good in all areas of this route. It was obvious that the crop was
behind normal maturity in most areas, and fall planted wheat that
did not emerge until this spring was found in a lot of places. This
would be the concern for the Kansas crop this year in areas where
this phenomenon occurred. Will this wheat have a decent yield, or
will it be too hot when head filling time approaches? Yields for the
day ranged from 15-94 bushels per acre with the day average on all
routes of 45.4 bushels. The day one average in 2007 was 40 bushels.
Day two
the cars traveled from Colby to Wichita going into the far Western
counties and two cars went farther south into Oklahoma. As we knew
beforehand, the far west and south are in the drought areas of
Kansas. The worst areas appeared to be in the far southwestern
corner and correspondingly south into the western Oklahoma
panhandle. The stands were much poorer in the southwest, and yields
responded accordingly. As the cars moved east toward Wichita, the
yields improved dramatically. The day two average was 40.9 with a
range from Zero to 108. The 108 was found in the Alva, Oklahoma area
where many yields we above 90 bushels. This may be the best crop
this area has ever experienced. The day two overall average last
year was 41.6 bushels per acre.
Day three
concluded the trip with the cars traveling from Wichita to Kansas
City. We lost two cars and several people in Wichita and made 31
stops in a muddy and time shortened day. This smaller wheat
production area does not have a large impact on state-wide averages,
but is usually a fairly high yielding area. Yields ranged from 28-64
bushels with a day three average of 43.3 compare to 32.4 last year.
There was a lot of freeze damage in this area in 2007.
The
calculated average for the entire tour was 43.3 bushels
per acre compared to 41 bushels one year ago on the same routes. The
scouts use a formula provided by KS Ag Statistics to arrive at their
calculated average. The formula is based on a 10-year rolling
average and changes slightly from year to year.
The
estimated production for the entire crop by 48
participants who joined the pool this year is 379.1
million bushels. These people base their estimates on yield
estimates and acres expected to be abandoned for some reason. On May
9, the official estimate from Kansas Ag Statistics was
357.2 million bushels. They did their official survey
about a week ahead of our tour.
We were not joined
by scouts from Colorado or Nebraska this year, but Oklahoma
gave a report in Wichita that listed 5.7 million acres planted with
a yield estimate of 32.4 bushels per acre and total production of
157 million bushels. They only produced 98 million bushels last
year.
My personal
observations are that this crop has some upside potential. The later
planted wheat is beginning to catch up, and when the sun ever
shines, should make great strides. I believe the crop will improve
from week to week, and had Ag Statistics been out the same week as
we were, their estimate may have been higher. The best
characteristic of the crop is the apparent lack of disease. We saw
almost none of the rust that was reported ahead of the tour, and
almost nothing else that would detract form this crop. I think the
only thing it needs is sunshine, like almost every place else in the
plains states. If we go directly from 60 to 90 degrees however, that
spring emerged wheat may take a big hit. I really have no idea how
much of it there is, but there did not appear to be a huge amount.
It has plenty of moisture except in the western areas, and I think
it is too late to help them a lot in those areas.
Please keep in
mind that this whole tour is a snapshot in time regarding the
potential of this crop. Weather will continue to have more influence
than anything else on the final outcome.
About one-half of
our group were first-timers. They all reported learning a lot about
wheat while having a good time. The value of this tour is the people
you meet and the friends you make and keep in contact with over the
years to come. The production number really takes a back seat in the
whole process, although I believe we did a fine job again and are
proud of our effort. This is truly a diverse group of really nice
people.
Thanks to all who
sent employees, provided cars and helped in many other ways to make
this tour a success. I look forward to your support again next year
on the 53rd annual Wheat Quality Council Hard Winter Wheat Tour.
Please
share this information with others in your organization who may not
be on our email list!!
Remember our Hard
Spring and Durum tour coming up on July 28-31. This tour covers
North Dakota plus parts of Minnesota and South Dakota. This year a
few of us will venture into Montana to look for a few more Durum
fields to report on. The format is very similar to the winter tour,
and registration forms are available on our web site at
wwwwheatqualitycouncil.org