![]() Hard
Winter Wheat Quality Tour 2010
Hard
Winter Wheat Quality Tour 2010
| Hard Winter Wheat Quality Tour 2010 | All Averages are Weighted | ||||||
| Day One - May 4 | Range | Range | |||||
| Route | Car Average | Stops | Low | High | Route Avg | ||
| Purple 1 | 51 | 11 | 42 | 57 | |||
| Purple 2 | 40 | 21 | 32 | 50 | |||
| Purple 3 | |||||||
| Purple 4 | 44 | ||||||
| Green 1 | 37 | 13 | 25 | 53 | |||
| Green 2 | 39 | 16 | 28 | 54 | |||
| Green 3 | 37 | 18 | 25 | 52 | |||
| Green 4 | 38 | ||||||
| Pink 1 | 40 | 17 | 28 | 58 | |||
| Pink 2 | 39 | 13 | 22 | 57 | |||
| Pink 3 | 37 | 12 | 22 | 53 | |||
| Pink 4 | 39 | ||||||
| Yellow 1 | 39 | 12 | 22 | 58 | |||
| Yellow 2 | 39 | 15 | 31 | 47 | |||
| Yellow 3 | 39 | ||||||
| Blue 1 | 43 | 13 | 32 | 70 | |||
| Blue 2 | 54 | 14 | 34 | 77 | 2009 41.3 215 stops | ||
| Blue 3 | 44 | 12 | 36 | 63 | 2008 45.4 190 stops | ||
| Blue 4 | 47 | 2007 40.0 209 stops | |||||
| Black 1 | 35 | 12 | 30 | 44 | 2006 40.6 210 stops | ||
| Black 2 | 40 | 14 | 25 | 62 | 2005 48.9 192 stops | ||
| Black 3 | 38 | 2004 38.0 202 stops | |||||
| 2003 38.6 179 stops | |||||||
| Total Stops | 213 | Day 1 Avg | 40.7 | 2002 37.4 234 stops | |||
| Hard Winter Wheat Quality Tour 2010 | All Averages are Weighted | ||||||
| Day Two - May 5 | Range | Range | |||||
| Route | Car Average | Stops | Low | High | Route Avg | ||
| Purple 1 | 36 | 14 | 27 | 50 | Oklahoma | ||
| Purple 2 | 45 | 16 | 24 | 69 | 5.2 MM Planted | ||
| Purple 3 | Est 33.5 b/a | ||||||
| Purple 4 | 41 | Prod Est 141MM bu | |||||
| Green 1 | 40 | 11 | 27 | 78 | LY 77MM bu Prod | ||
| Green 2 | 43 | 16 | 24 | 68 | |||
| Green 3 | 35 | 19 | 21 | 54 | KS Two Day Totals | KS Two Day | |
| Green 4 | 39 | Avg | 40.3 | ||||
| Pink 1 | 36 | 17 | 21 | 62 | Stops | 428 | |
| Pink 2 | 39 | 13 | 27 | 53 | 2009 2 day 40.6/427 | ||
| Pink 3 | 45 | 12 | 30 | 65 | 2008 2 day 43.3/357 | ||
| Pink 4 | 39 | 2007 2 day 41.6/417 | |||||
| Yellow 1 | 39 | 11 | 23 | 64 | 2006 2 day 37.2/404 | ||
| Yellow 2 | 34 | 14 | 21 | 46 | 2005 2 day 46.5/399 | ||
| Yellow 3 | 36 | 2004 2-day 36.7/407 | |||||
| Blue 1 | 42 | 13 | 28 | 63 | 2003 2-day 38.1/371 | ||
| Blue 2 | 47 | 14 | 24 | 65 | 2002 2-day 34.5/442 | ||
| Blue 3 | 41 | 16 | 27 | 60 | 2009 D2 39.8/212 stops | ||
| Blue 4 | 43 | 2008 D2 40.9/167 stops | |||||
| Black 1 | 39 | 15 | 20 | 54 | 2007 D2 43.2/208 stops | ||
| Black 2 | 42 | 14 | 20 | 57 | 2006 D2 33.5/194 stops | ||
| Black 3 | 40 | 2005 D2 44.2/207 stops | |||||
| 2004 D2 35.4/205 stops | |||||||
| Total Stops | 215 | Day 2 Avg | 39.9 | 2003 D2 37.7/192 stops | |||
| 2002 D2 31.3/208 stops | |||||||
| Hard Winter Wheat Quality Tour 2010 | All Averages are Weighted | ||||||
| Day Three - May 6 | Range | Range | |||||
| Route | Car Average | Stops | Low | High | Route Avg | ||
| Purple 1 | |||||||
| Purple 2 | 43 | 2 | 42 | 44 | |||
| Purple 3 | |||||||
| Purple 4 | 43 | ||||||
| Green 1 | |||||||
| Green 2 | 50 | 3 | 46 | 53 | |||
| Green 3 | 47 | 3 | 16 | 76 | |||
| Green 4 | 48 | ||||||
| Pink 1 | 35 | 3 | 29 | 40 | |||
| Pink 2 | 64 | 3 | 42 | 107 | |||
| Pink 3 | 56 | 2 | 55 | 57 | |||
| Pink 4 | 51 | ||||||
| Yellow 1 | 44 | 2 | 34 | 53 | |||
| Yellow 2 | |||||||
| Yellow 3 | 44 | ||||||
| Blue 1 | 36 | 3 | 29 | 48 | |||
| Blue 2 | |||||||
| Blue 3 | 35 | 3 | 26 | 48 | 2009 D3 43.7/32 stops | ||
| Blue 4 | 36 | 2008 D3 43.3/31 stops | |||||
| Black 1 | 56 | 3 | 48 | 70 | 2007 D3 32.4/30 stops | ||
| Black 2 | 2006 D3 38.8/31 stops | ||||||
| Black 3 | 56 | 2005 D3 42.8/36 stops | |||||
| 2004 D3 44.0/46 stops | |||||||
| Total Stops | 27 | Day 3 Avg | 46.4 | 2003 D3 43.8/45 stops | |||
| 2002 D3 47.3/41 stops | |||||||
| Hard Winter Wheat Quality Tour 2010 | |||||||
| Three Day Total | May 4-6, 2010 | Yield Potential | |||||
| All Averages are Weighted | |||||||
| Stops | Stop/Car | Average | Low | High | |||
| Day 1 | 213 | 14.2 | 40.7 | 21.6 | 77.3 | ||
| Day 2 | 215 | 14.3 | 39.9 | 19.7 | 78 | ||
| Day 3 | 27 | 2.7 | 46.4 | 16 | 107 | ||
| Total | 455 | 31.2 | 40.7 | ||||
| Historical | |||||||
| Year | Day 1 | Day 2 | Day 3 | Average | Stops | ||
| 2009 | 41.3 | 39.8 | 43.7 | 40.8 | 459 | ||
| 2008 | 45.4 | 40.9 | 43.3 | 43.3 | 388 | ||
| 2007 | 40.0 | 43.2 | 32.4 | 41.0 | 447 | ||
| 2006 | 40.6 | 33.5 | 38.8 | 37.3 | 435 | ||
| 2005 | 48.9 | 44.2 | 42.8 | 46.2 | 435 | ||
| 2004 | 38.0 | 35.4 | 44.0 | 37.4 | 453 | ||
| 2003 | 38.6 | 37.7 | 43.8 | 38.8 | 416 | ||
| 2002 | 37.4 | 31.3 | 47.3 | 35.6 | 483 | ||
| 2001 | 32.6 | 31.7 | 39.0 | 32.7 | 480 | ||
| 2000 | 40.8 | 41.4 | 45.1 | 41.4 | 479 | ||
| 1999 | 38.0 | 40.0 | 37.2 | 38.9 | 527 | ||
| Tour Participants - Breakdown | |||||||
| Class | Number | Percent | |||||
| Government | 4 | 6 | |||||
| University | 5 | 7 | |||||
| Media | 6 | 9 | |||||
| Grain | 8 | 12 | |||||
| Milling | 18 | 26 | |||||
| Baker | 5 | 7 | |||||
| Producers | 10 | 15 | |||||
| Other | 12 | 18 | |||||
2010 Wheat Quality Council Hard Winter Tour Completed
Fifteen cars with 67 crop scouts surveyed and evaluated the potential of the Kansas wheat crop the week of May 3-6, 2010. The total number of field stops was 455 compared to 459 one year ago. This year the weather was great for all three days, and we had the largest number of participants in history.
The participants attended a brief training and tour overview session in Manhattan on the evening of May 3 before enjoying a great steak fry. The dinner was held at the IGP facility on the north end of the campus of KSU. Participants toured the Hal Ross flour mill after dinner.
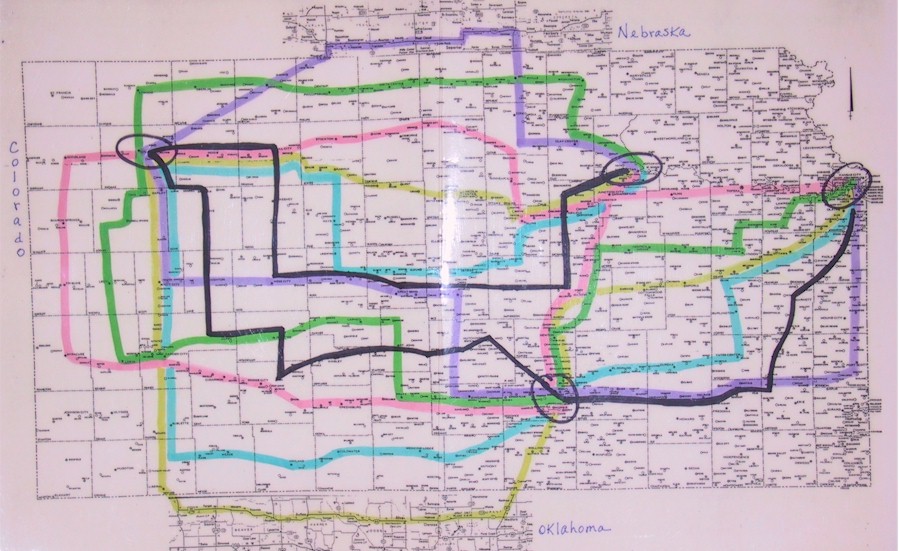
Day one saw the 15 cars traveling on six different routes from Manhattan to Colby. (See tour map). The wheat seemed to be a little better right through the center of the state, and the Nebraska route found excellent wheat. Very little disease pressure was found by the scouts. Yields for the day ranged from 22-77 bushels per acre with the day one average on all routes at 40.7 bushels. This compares with 41.3 bushels one year ago. We stopped in 213 fields on day one. A group scouted eastern Colorado and reported a yield average of 36.5 bushels and estimated a total production of 81 million bushels for 2010. They also found little disease.
Day Two the cars traveled from Colby to Wichita. Several cars went
into the far western Kansas counties and two cars actually covered the
northern tier of Oklahoma counties. The western Kansas area was reported
as being very dry, and a good rain would help the crop significantly.
The cars in Oklahoma found good yields that got better as they moved
eastward. The day two average was 39.9 bushels per acre compared to 40.6
in 2009. We had a range from 20-78 bushels and made 215 stops. Oklahoma
reported an estimated 33.5 bushels per acre and a total production of
141 million bushels. This compares with the disastrous 77 million last
year.
Day Three concluded the trip with the cars traveling from Wichita to Kansas City. We lost several cars and people in Wichita and made 27 stops on the shortened day. This smaller production area does not have a significant impact on the state-wide average, but is usually a high yielding area. Yields ranged from 16-107 bushels with the day three average at 46.4 compared to 43.7 last year. Moisture seemed to be adequate across this area of the state.
The Calculated Average for the entire tour was 40.7 bushels per acre compared to 40.8 bushels on the same routes in 2009. The scouts use a formula provided by KS Ag Statistics to arrive at their calculated average. The formula is based on a 10-year rolling average and changes slightly from year to year.
The Estimated Production for the Kansas crop by 56 participants who
joined the pool this year is 333.5 million bushels. These people base
their estimates on yield estimates and acres expected to be harvested.
There are always a number of abandoned acres and they attempt to factor
that into the equation. KS Ag Statistics will release their official
estimate of the crop on Tuesday, May 11. They surveyed the crop about
the same time we did.
My personal observations, for what they’re worth, are as follows:
Most parts of the state have adequate moisture, the exception being the southwest region. I arrived in Kansas expecting to see an above average crop. As the tour progressed, I became more convinced that the crop would be closer to a normal one. I believe our 40.7 bushel average will be very close the actual one. The 10-year average for Kansas is around 350 million bushels. Our estimators, at 333.5 are a little under that number, but a lot can happen in the next month to change this crop by that much. Keep in mind that we also have fewer planted acres this year.
The good news is that most of the crop appears to be very healthy and has that good dark green color. We did observe some nitrogen deficiency problems in isolated areas. The good rainfall totals appear to have leached the N too far down for the shallow rooted wheat to reach it. We have some producers concerned about leaf rust, but this would not appear to be a huge issue overall. Some stripe rust and tan spot was observed, but they too appear to be a relatively small problem at this time. I was very pleased with the lack of weed pressure in the areas I traveled.
Please keep in mind that this whole tour is a snapshot in time regarding the potential of this crop. About half of our group was first-timers. They reported learning a lot about wheat while having a good time doing it. The value of this exercise is the people you meet and the friends you make and keep in contact with over the years to come. Although I think we did a fine job of estimating the crop potential that really takes a back seat to the real value of the tour. This was truly a very diverse group of very nice people.
Thanks to all who sent employees, provided cars and helped in many ways to make this tour a success. I look forward to your support on our 54th annual Wheat Quality Council Hard Winter Wheat Tour.
Please share this information with others in your organization that may not be on our email list!!!
Remember our Hard Spring and Durum tour coming up on July 26-29. This tour covers North Dakota plus parts of Minnesota and South Dakota. A few brave souls will venture into Montana to look for a few more Durum fields to report on. The format is very similar to the winter tour, and registration forms are available on our web site at www.wheatqualitycouncil.org.