|
Hard Winter Wheat Tour Summary by Ben Handcock
2012 Wheat Quality Council Hard Winter Tour
Completed
Twenty-one cars with 97 crop scouts surveyed and evaluated the potential of the Kansas wheat crop the week of April 30-May 3, 2012. The total number of field stops was 608 compared to 561 one year ago. This year the weather was great for all three days, and we had the largest number of participants in history.
The participants attended a brief training and tour overview session in Manhattan on the evening of April 30 before enjoying a great steak fry. The dinner was held at the Rambler’s Steak House in Manhattan.
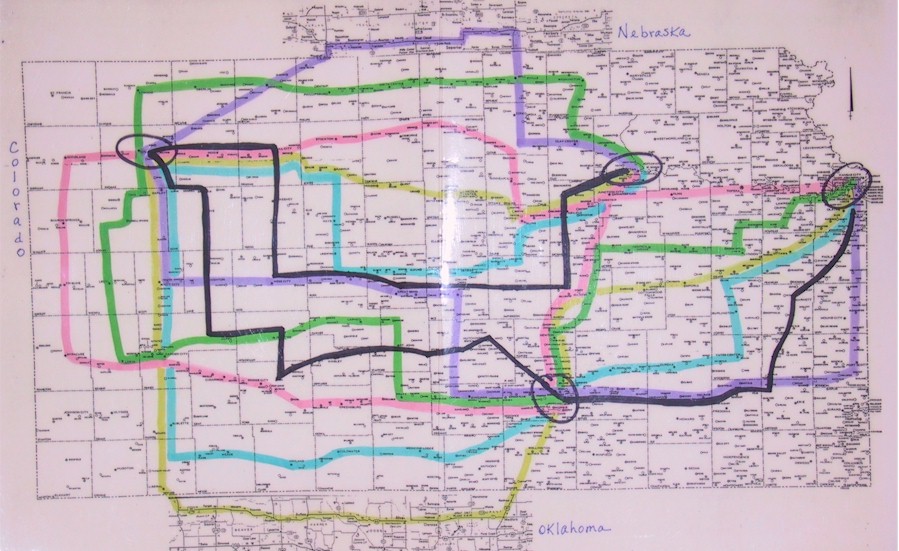
Day one saw the 21 cars traveling on six different routes from Manhattan to Colby. (See tour map). The wheat seemed consistently good on most routes, and the Nebraska route found good wheat. Considerable disease pressure was found by the scouts. Yields for the day ranged from 21-120 bushels per acre with the day one average on all routes at 53.4 bushels. This compares with 40 bushels one year ago. We stopped in 280 fields on day one. A group scouted eastern Colorado and reported a yield average of 40 bushels and estimated a total production of 88 million bushels for 2012.
Day Two the cars traveled from Colby to Wichita. Several cars went into the far western Kansas counties and three cars actually covered the northern tier of Oklahoma counties. The western Kansas area was reported as being still quite dry, and in serious need of a good rain. The cars in Oklahoma found fair yields in very dry fields in the west but improvement as they moved east. The day two average was 43.7 bushels per acre compared to 33.4 in 2011. We had a range from 8-99 bushels and made 286 stops. Oklahoma reported an estimated 39.6 bushels per acre and a total production of 164.9 million bushels. This compares with 67.7 million estimated at this time last year.
Day Three concluded the trip with the cars traveling from Wichita to Kansas City. We lost a car and a few people in Wichita and made 42 stops on the shortened day. This smaller production area does not have a significant impact on the state-wide average, but is usually a high yielding area. Yields ranged from 33-100 bushels with the day three average at 57.5 compared to 49.5 last year. Moisture seemed to be better across this area of the state.
The Calculated Average for the entire tour was 49.1 bushels per acre compared to 37.4 bushels on the same routes in 2011. The scouts use a formula provided by KS Ag Statistics to arrive at their calculated average. The formula is based on a 10-year rolling average and changes slightly from year to year.
The Estimated Production for the Kansas crop by 63 participants who joined the pool this year is 403.8 million bushels. These people base their estimates on yield estimates and acres expected to be harvested. There are always a number of abandoned acres and they attempt to factor that into the equation. KS Ag Statistics released their official estimate of the crop today. They had production estimates of 387 million bushels and 43 bushels per acre.
My personal observations, for what they’re
worth, are as follows:
Western parts of the state are still seriously short of moisture. I arrived in Kansas expecting to see a much better crop than last year, and that’s what I saw. As the tour progressed, I became more convinced that the crop would be higher than average. I believe our 49.1 bushel average will be a bit too high. The 10-year average for Kansas is around 350 million bushels. Our estimators, at 403.8 are above that number, and I believe even that number is too high. I suspect that a good number of the small tillers will be lost before harvest. I think there is a lot more downside potential to this crop than upside.
The reason I say this is because of the disease pressure I saw. Some wheat that had just headed had pretty severe stripe rust on the flag leaf, along with a lot of other leaf diseases. I’m not sure there will be enough flag leaf left to ensure proper grain fill. All in all though, this is a pretty nice crop.
Please keep in mind that this whole tour is a snapshot in time regarding the potential of this crop. Fifty-five of our 97 participants were first-timers. They reported learning a lot about wheat while having a good time doing it. The value of this exercise is the people you meet and the friends you make and keep in contact with over the years to come. Although I think we did a fine job of estimating the crop potential that really takes a back seat to the real value of the tour. This was truly a very diverse group of very nice people.
Thanks to all who sent employees, provided cars and helped in many ways to make this tour a success. I look forward to your support on our 56th annual Wheat Quality Council Hard Winter Wheat Tour.
Please share this information with others in your organization that may not be on our email list!!!
Remember our Hard Spring and Durum tour coming up on July 23-26. This tour covers North Dakota plus parts of Minnesota and South Dakota. A few brave souls might venture near the Montana border to look for a few more Durum fields to report on. The format is very similar to the winter tour, and registration forms are available on our web site at
www.wheatqualitycouncil.org. |