![]() Hard
Winter Wheat Quality Tour 2011
Hard
Winter Wheat Quality Tour 2011
| Hard Winter Wheat Quality Tour 2011 | All Averages are Weighted | ||||||
| Day One - May 3 | Range | Range | |||||
| Route | Car Average | Stops | Low | High | Route Avg | ||
| Purple 1 | 36 | 13 | 18 | 64 | |||
| Purple 2 | 46 | 15 | 32 | 78 | |||
| Purple 3 | |||||||
| Purple 4 | 41 | 13 | 30 | 48 | 41.2 | ||
| Green 1 | 42 | 17 | 26 | 58 | |||
| Green 2 | 40 | 15 | 20 | 75 | |||
| Green 3 | 42 | 16 | 18 | 59 | |||
| Green 4 | 41.6 | ||||||
| Pink 1 | 46 | 13 | 34 | 64 | |||
| Pink 2 | 41 | 12 | 30 | 62 | |||
| Pink 3 | |||||||
| Pink 4 | 41 | 15 | 25 | 50 | 42.5 | ||
| Yellow 1 | 39 | 15 | 22 | 64 | |||
| Yellow 2 | 38 | 16 | 19 | 56 | |||
| Yellow 3 | 38 | 17 | 18 | 53 | 38.2 | ||
| Blue 1 | 41 | 17 | 27 | 63 | 2010 40.7 213 stops | ||
| Blue 2 | 37 | 17 | 28 | 76 | 2009 41.3 215 stops | ||
| Blue 3 | 40 | 12 | 25 | 51 | 2008 45.4 190 stops | ||
| Blue 4 | 39.3 | 2007 40.0 209 stops | |||||
| Black 1 | 35 | 16 | 16 | 61 | 2006 40.6 210 stops | ||
| Black 2 | 37 | 15 | 20 | 71 | 2005 48.9 192 stops | ||
| Black 3 | 42 | 13 | 30 | 50 | 37.9 | 2004 38.0 202 stops | |
| 2003 38.6 179 stops | |||||||
| Total Stops | 267 | Day 1 Avg | 40.0 | 2002 37.4 234 stops | |||
| Hard Winter Wheat Quality Tour 2011 | All Averages are Weighted | ||||||
| Day Two - May 4 | Range | Range | |||||
| Route | Car Average | Stops | Low | High | Route Avg | ||
| Purple 1 | 35 | 14 | 27 | 51 | Oklahoma | ||
| Purple 2 | 36 | 19 | 24 | 62 | 5.2 MM Planted | ||
| Purple 3 | 28 | 15 | 11 | 46 | Est 20.5 b/a | ||
| Purple 4 | 33.2 | Prod Est 67.7MM bu | |||||
| Green 1 | 36 | 13 | 16 | 53 | LY 120.9MM bu Prod | ||
| Green 2 | 31 | 14 | 12 | 77 | |||
| Green 3 | KS Two Day Totals | KS Two Day | |||||
| Green 4 | 33.4 | Avg | 36.7 | ||||
| Pink 1 | 35 | 17 | 13 | 84 | Stops | 531 | |
| Pink 2 | 33 | 14 | 18 | 47 | 2010 2 day 40.3/428 | ||
| Pink 3 | 34 | 13 | 19 | 54 | 2009 2 day 40.6/427 | ||
| Pink 4 | 36 | 15 | 24 | 64 | 34.6 | 2008 2 day 43.3/357 | |
| Yellow 1 | 35 | 14 | 19 | 63 | 2007 2 day 41.6/417 | ||
| Yellow 2 | 34 | 17 | 2 | 68 | 2006 2 day 37.2/404 | ||
| Yellow 3 | 36 | 15 | 0 | 81 | 35.0 | 2005 2 day 46.5/399 | |
| Blue 1 | 27 | 15 | 13 | 63 | 2004 2-day 36.7/407 | ||
| Blue 2 | 40 | 16 | 7 | 73 | 2003 2-day 38.1/371 | ||
| Blue 3 | 30 | 10 | 19 | 61 | 2010 D2 39.9/215 stops | ||
| Blue 4 | 32.6 | 2009 D2 39.8/212 stops | |||||
| Black 1 | 29 | 15 | 0 | 44 | 2008 D2 40.9/167 stops | ||
| Black 2 | 33 | 15 | 18 | 48 | 2007 D2 43.2/208 stops | ||
| Black 3 | 31 | 13 | 19 | 45 | 31.0 | 2006 D2 33.5/194 stops | |
| 2005 D2 44.2/207 stops | |||||||
| Total Stops | 264 | Day 2 Avg | 33.4 | 2004 D2 35.4/205 stops | |||
| 2003 D2 37.7/192 stops | |||||||
| Hard Winter Wheat Quality Tour 2011 | All Averages are Weighted | ||||||
| Day Three - May 5 | Range | Range | |||||
| Route | Car Average | Stops | Low | High | Route Avg | ||
| Purple 1 | 56 | 2 | 45 | 66 | |||
| Purple 2 | |||||||
| Purple 3 | |||||||
| Purple 4 | 56.0 | ||||||
| Green 1 | |||||||
| Green 2 | 60 | 4 | 43 | 94 | |||
| Green 3 | |||||||
| Green 4 | 60.0 | ||||||
| Pink 1 | 36 | 3 | 33 | 42 | |||
| Pink 2 | |||||||
| Pink 3 | |||||||
| Pink 4 | 36.0 | ||||||
| Yellow 1 | 44 | 3 | 40 | 48 | |||
| Yellow 2 | 47 | 3 | 39 | 62 | |||
| Yellow 3 | 45.4 | ||||||
| Blue 1 | 47 | 2 | 46 | 47 | |||
| Blue 2 | 53 | 4 | 41 | 62 | |||
| Blue 3 | 47 | 2 | 45 | 49 | 2010 D3 46.4/27 stops | ||
| Blue 4 | 50.0 | 2009 D3 43.7/32 stops | |||||
| Black 1 | 49 | 2 | 45 | 49 | 2008 D3 43.3/31 stops | ||
| Black 2 | 36 | 1 | 36 | 36 | 2007 D3 32.4/30 stops | ||
| Black 3 | 55 | 4 | 45 | 77 | 50.6 | 2006 D3 38.8/31 stops | |
| 2005 D3 42.8/36 stops | |||||||
| Total Stops | 30 | Day 3 Avg | 49.5 | 2004 D3 44.0/46 stops | |||
| 2003 D3 43.8/45 stops | |||||||
| Hard Winter Wheat Quality Tour 2011 | |||||||
| Three Day Total | May 3-5, 2011 | Yield Potential | |||||
| All Averages are Weighted | |||||||
| Stops | Stop/Car | Average | Low | High | |||
| Day 1 | 267 | 14.8 | 40.0 | 15.6 | 77.9 | ||
| Day 2 | 264 | 14.7 | 33.4 | 0 | 83.5 | ||
| Day 3 | 30 | 2.7 | 49.5 | 33 | 94 | ||
| Total | 561 | 32.2 | 37.4 | ||||
| Historical | |||||||
| Year | Day 1 | Day 2 | Day 3 | Average | Stops | ||
| 2010 | 40.7 | 39.9 | 46.4 | 40.7 | 455 | ||
| 2009 | 41.3 | 39.8 | 43.7 | 40.8 | 459 | ||
| 2008 | 45.4 | 40.9 | 43.3 | 43.3 | 388 | ||
| 2007 | 40.0 | 43.2 | 32.4 | 41.0 | 447 | ||
| 2006 | 40.6 | 33.5 | 38.8 | 37.3 | 435 | ||
| 2005 | 48.9 | 44.2 | 42.8 | 46.2 | 435 | ||
| 2004 | 38.0 | 35.4 | 44.0 | 37.4 | 453 | ||
| 2003 | 38.6 | 37.7 | 43.8 | 38.8 | 416 | ||
| 2002 | 37.4 | 31.3 | 47.3 | 35.6 | 483 | ||
| 2001 | 32.6 | 31.7 | 39.0 | 32.7 | 480 | ||
| 2000 | 40.8 | 41.4 | 45.1 | 41.4 | 479 | ||
| 1999 | 38.0 | 40.0 | 37.2 | 38.9 | 527 | ||
| Tour Participants - Breakdown | |||||||
| Class | Number | Percent | |||||
| Government | 2 | 3 | |||||
| University | 3 | 4 | |||||
| Media | 4 | 6 | |||||
| Grain | 25 | 35 | |||||
| Milling | 15 | 21 | |||||
| Baker | 6 | 8 | |||||
| Producers | 2 | 3 | |||||
| Other | 15 | 21 | |||||
Hard Winter Wheat Tour Summary by Ben Handcock
2011 Wheat Quality Council Hard Winter Tour Completed
Eighteen cars with 72 crop scouts surveyed and evaluated the potential of the Kansas wheat crop the week of May 2-5, 2011. The total number of field stops was 561 compared to 455 one year ago. This year the weather was great for all three days, and we had the largest number of participants in history.
The participants attended a brief training and tour overview session in Manhattan on the evening of May 2 before enjoying a great steak fry. The dinner was held at the Rambler’s Steak House following a tour of the Tall Grass Brewery.
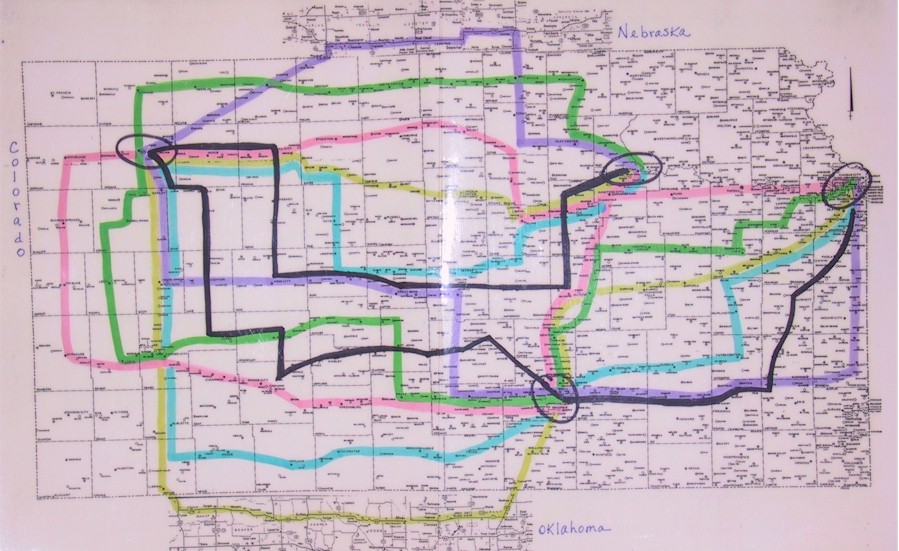
Day one saw the 18 cars traveling on six different routes from Manhattan to Colby. (See tour map). The wheat seemed quite variable on most routes, and the Nebraska route found good wheat. The Nebraska yield was pegged at 42.3 bushels per acre with a production number of 63 million bushels. Very little disease pressure was found by the scouts. Yields for the day ranged from 16-78 bushels per acre with the day one average on all routes at 40.0 bushels. This compares with 40.7 bushels one year ago. We stopped in 267 fields on day one. A group scouted eastern Colorado and reported a yield average of 32.4 bushels and estimated a total production of 78.8 million bushels for 2011. They also found little disease.
Day Two the cars traveled from Colby to Wichita. Several cars went into the far western Kansas counties and three cars actually covered the northern tier of Oklahoma counties. The western Kansas area was reported as being very dry, and in serious need of a good rain. The cars in Oklahoma found fair yields in very dry fields. The day two average was 33.4 bushels per acre compared to 40.3 in 2010. We had a range from 0-84 bushels (in an irrigated field) and made 264 stops. Oklahoma reported an estimated 20.5 bushels per acre and a total production of 67.7 million bushels. This compares with 141 million estimated at this time last year.
Day Three concluded the trip with the cars traveling from Wichita to Kansas City. We lost several cars and people in Wichita and made 30 stops on the shortened day. This smaller production area does not have a significant impact on the state-wide average, but is usually a high yielding area. Yields ranged from 33-94 bushels with the day three average at 49.5 compared to 46.4 last year. Moisture seemed to be better across this area of the state.
The Calculated Average for the entire tour was 37.4 bushels per acre compared to 40.7 bushels on the same routes in 2010. The scouts use a formula provided by KS Ag Statistics to arrive at their calculated average. The formula is based on a 10-year rolling average and changes slightly from year to year.
The Estimated Production for the Kansas crop by 54 participants who joined the pool this year is 256.7 million bushels. These people base their estimates on yield estimates and acres expected to be harvested. There are always a number of abandoned acres and they attempt to factor that into the equation. KS Ag Statistics will release their official estimate of the crop on Wednesday, May 11. They surveyed the crop about the same time we did.
My personal observations, for what they’re worth, are as follows:
Most parts of the state are seriously short of moisture. I arrived in Kansas expecting to see a much poorer crop than last year, and that’s what I saw. As the tour progressed, I became more convinced that the crop would be much lower than average. I believe our 37.4 bushel average will be a bit too high. The 10-year average for Kansas is around 350 million bushels. Our estimators, at 256.7 are much below that number, and I believe even that number is too high. I suspect that a good number of the small tillers will be lost in the next few days without significant moisture. I think there is a lot more downside potential to this crop than upside.
The good news is that most of the crop appears to show very little disease pressure as you would expect in a very dry year. We have many producers sitting on a 10-15 bushel crop they don’t know for sure what to do with. IF good rains were to develop, they might even abandon more wheat and plant grain sorghum or something. Even now, I believe the abandonment will be 20% or higher.
Please keep in mind that this whole tour is a snapshot in time regarding the potential of this crop. Thirty-five of our 72 participants were first-timers. They reported learning a lot about wheat while having a good time doing it. The value of this exercise is the people you meet and the friends you make and keep in contact with over the years to come. Although I think we did a fine job of estimating the crop potential that really takes a back seat to the real value of the tour. This was truly a very diverse group of very nice people.
Thanks to all who sent employees, provided cars and helped in many ways to make this tour a success. I look forward to your support on our 55th annual Wheat Quality Council Hard Winter Wheat Tour.
Please share this information with others in your organization that may not be on our email list!!!
Remember our Hard Spring and Durum tour coming up on July 25-28. This tour covers North Dakota plus parts of Minnesota and South Dakota. A few brave souls will venture near the Montana border to look for a few more Durum fields to report on. The format is very similar to the winter tour, and registration forms are available on our web site at www.wheatqualitycouncil.org.